
Edsembli SIS is a web based Student Information System (SIS) designed specifically to manage all aspects of student data. In addition to student data, Edsembli SIS provides feature rich applications for use in the school and board/division/district offices, as well as the classroom. Our goal is to simplify the processes needed to collect and manage the increasing amount of student and school information, and to share this information with all education stakeholders, including students and their parents/guardians.
In a school board/division/district the data for all schools is stored in one common database. The board/division/district has centralized control over certain aspects of Edsembli SIS to ensure consistency across the schools. Each student is stored once in the database but may be concurrently enrolled in multiple schools, with each school having full control over the school specific data for the student.
The SIS database is accessible to only those users who have been granted security rights. Security rights determine not only which schools and which students a user has access to, they also determine what areas of Edsembli SIS may be accessed and whether data may be viewed and/or edited.
Edsembli SIS will have a unique user experience for school office staff, board/division/district staff, teachers, students and their parents/guardians. Depending on the area of Edsembli SIS, there may be slight variations for different provinces or jurisdictions and differences for grade levels (e.g. elementary vs secondary students). These differences will be noted throughout the manual.
Below is a list of dashboards that are organized by subject:
Please note throughout the system permissions must be granted to view any given area. These can be viewed by selecting the four bars on the top left hand corner of the screen.
Along the toolbar on the top right hand side you'll find the following:
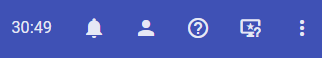
The time is how much time you have left in your session. The bell alerts you to notifications. The person icon is where you go to sign out. The circle with the question mark inside takes you to the manuals. The computer with the question mark is for your help and the three vertical dots provides you with information regarding your account, the option to change theme, change your help, sign out and support information
A brief description of each of the widgets is provided below for your reference.
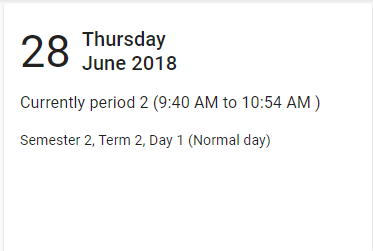
This tile displays the current date, period, semester, term and the day.
This tile notes special events or occasions for the given day.
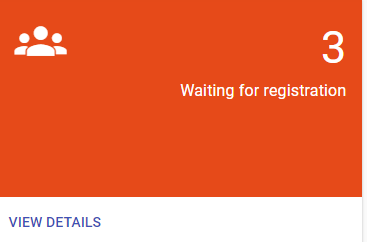
This tile shows how many students are waiting for registration. Selecting "View Details" shows the student name, birthdate and expected entry date.
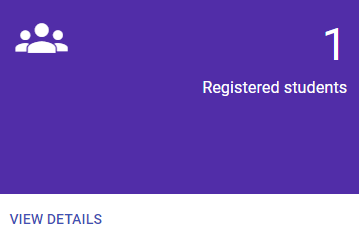
This tile shows how many students are registered. Selecting "View Details" provides the name of the student, school year status and who the record owner is.
This tile summarizes the number students enrolled. Selecting "View Details" provides the student's name and which years the student is registered. It also provides the option to search by student name.
This tile provides the number of students enrolled in special education programs. By clicking "View Details" you will see a list of the student names, school year status and grade.
This tile shows how many students have left the school.
This tile shows how many new enrolments in the current month there were.
This tile identifies the number of student suspensions in the current month. Selecting "View Details" will show the student(s) name, their school year status and grade.
This tile shows how many students are enrolled in next year only. Selecting "View Details" will provide the opportunity to select by this and next year, this year only, etc. and conduct a search by student.
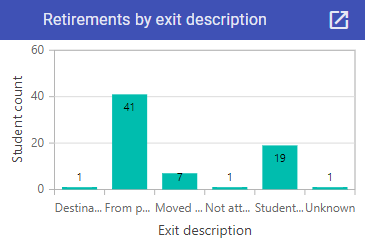
Dependent on your permissions, this tile can be viewed to see an overview of why students are no longer enrolled.
This tile shows the number of students without a timetable. Selecting "View Details" provides the student name(s), school year status, grade, etc.
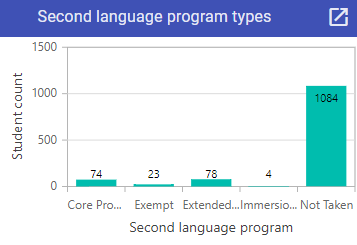
This graph shows the status of second language programs.
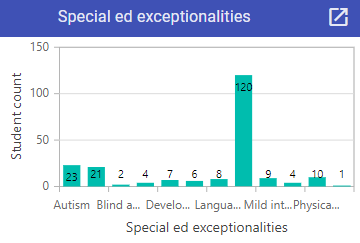
This graph shows the nature of the special education expectionalities.
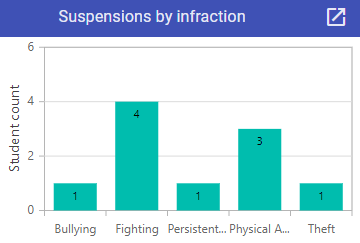
This graph shows the number of suspensions by infraction.