Use these links to learn more about advanced features use:
1. Set the Request Parameters property of the Report to YES.
2. Add your own parameters to the Parameters Collection. Edit the existing (Maplewood-defined) parameters (LogoPath and ReportDate) and change their "Visible" property to NO. This will cause the program to ignore that parameter when prompting the user for entry to YOUR parameter. Your parameters must be set up with the Visible property set to YES so that it does prompt the user for entry.
3. The parameters will appear in the Field Tree right at the bottom under Parameters. Drag the field onto the report and set it up as you would any other field.
4. When the user runs the report, an input message box will appear, asking them for input into this field.
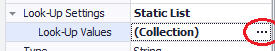
To allow the users to choose from a list of values in your parameter, once the Parameter is created, find Look-Up Settings in the Properties list. Set this to “Static List”. An arrow will appear beside Look-Up Settings – click it to expand, and find the Look-Up Values Collection.
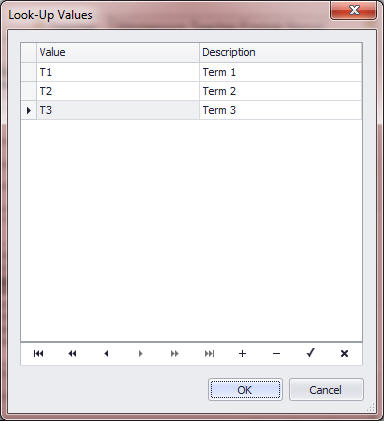
Click the ellipse (…) and add the desired values:
The user will be presented with the list for selection:
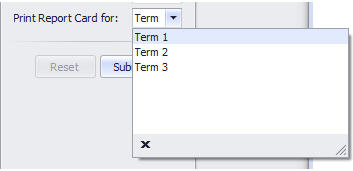
This can be used as a basic field on the report (in this case the data shown on the report would be T1, T2 or T3 respectively), or in a formatting rule (see Conditional Formatting section in manual).
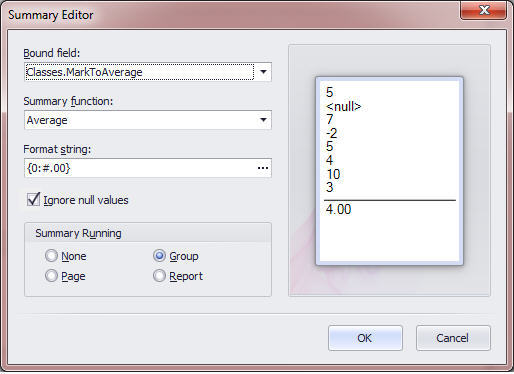
Using the average function on a field with a Before Print script (i.e., any mark/achievement field) is not possible, and using nested class & topic bands to get an average can be cumbersome and may give unexpected results.
To be sure to get an accurate student average, we must force the field to use the exact term and topic, via a calculated field with a “Get a Value” script:
e.Value = Nothing
Dim stuClass As StudentClass = DirectCast(e.Row, StudentClass)
If stuClass IsNot Nothing Then
Dim stuTopic As ClassTopic = stuClass.Topics.FindByTopicCode("MARK")
If stuTopic IsNot Nothing Then
Dim mark As TopicTermMark = stuTopic.FindMark("S2T1", False)
If mark IsNot Nothing Then
e.Value = Math.Round(mark.NumericMark.Value, 0, MidpointRounding.AwayFromZero)
End If
End If
End If
(edit term and topic IDs as necessary)
(change Format String as desired but make sure not to leave that field empty)
To obtain a student average over multiple topics (e.g., math strands) and multiple or single classes, follow the same instructions as above (single topic, multiple classes), but create a topic band under the class band, and create your calculated field in the Classes – Topics area of the field tree.
The summary field (average) still gets placed in the group footer of the class band.
The GetValue script for a topic band field is slightly different as well, as it pulls from the topic in the band instead of a hard-coded topic in the script:
e.Value = Nothing
Dim stuTopic As ClassTopic = DirectCast(e.Row, ClassTopic)
If stuTopic IsNot Nothing Then
Dim mark As TopicTermMark = stuTopic.FindMark("ONRP2", False)
If mark IsNot Nothing AndAlso mark.NumericMark >= 0 Then
e.Value = mark.NumericMark
End If
End If
The Formatting Rule Collection can be modified to make certain page elements act a certain way, depending on the data being shown. Please note, formatting rules can only be used with fields that do not have scripts attached. To edit a script to force formatting based on data value, please consult the Scripts part of the manual.
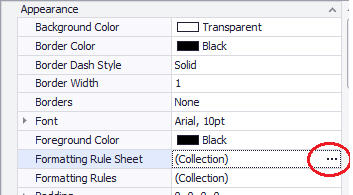
To begin, find Formatting Rule Sheet in the Property Grid of the report (xtraReport1). Click the ellipse (…) beside the Collection:
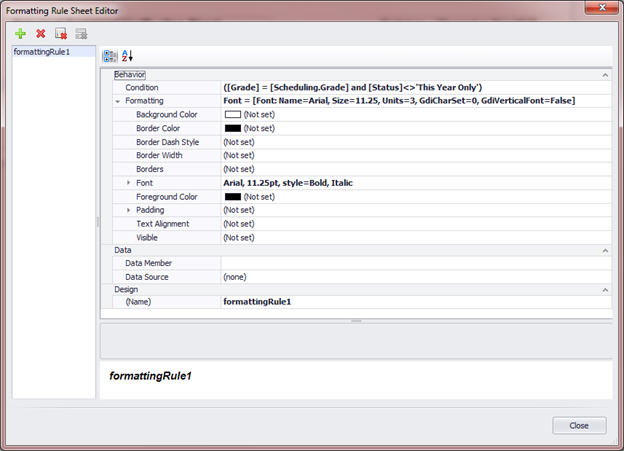
Add a new Formatting Rule (green plus-sign button). The following example, the font will change to Arial, size 11.25, Bold, Italic, when the student’s grade and scheduling grade are the same, and their status is not This Year Only (used to highlight students repeating a grade):
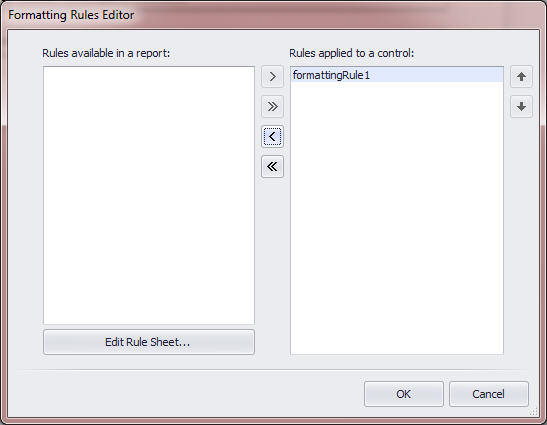
Next, attach your formatting rule to a control on the page. Select your tableCell, text box, table, etc, and then choose the ellipse beside Formatting Rules:
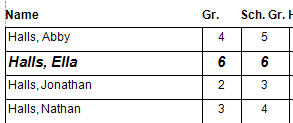
Example output (formatting rule was applied to all three cells – name, grade and scheduling grade):
Create a parameter (see the parameter section of the manual) and then use that as a field in your formatting rule. This example will cause a table (e.g., containing information about the student’s next year grade, etc) to only become visible if the value selected from the Term parameter is “T3” (the final term in the school):
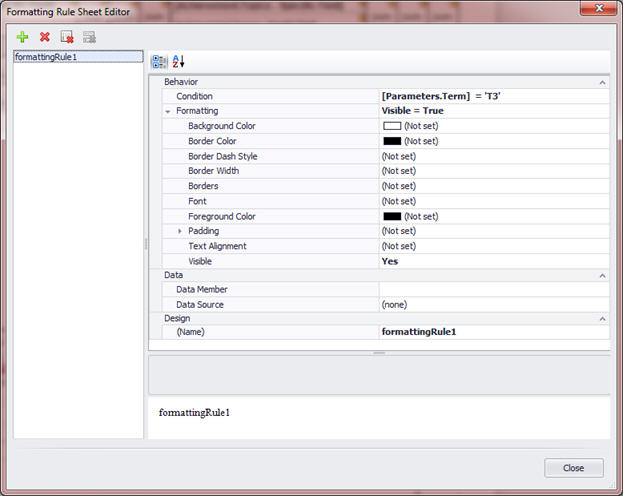
(Please note, in this case the actual Visible property of the table in question would need to be set to No, then the formatting rule applied so that it would cause the table to display only when T3 is selected from the parameters at run-time.)
E.g.:
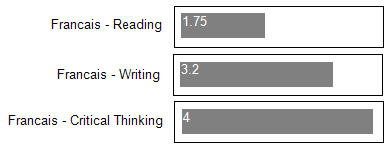
- Create a label with the desired background colour
- Make the text colour white if you wish for the numeric value to display. If not, make the text colour the same colour as the background.
- Bind the achievement field to the desired term & topic. If desired, choose one or two decimal places
- Edit the script of the bound achievement field and add this one line right after “If cmMark IsNot Nothing Then”:
control.Width =cmMark.NumericMark.Value * 50
- You will have to experiment with the value (50), as it will depend on the size of your label and the measurement units of the report
E.g.
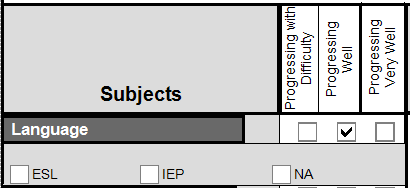
-Place a blank checkbox on the report
-While the checkbox is selected, go to the scripts pane and select BeforePrint to create a blank script
-Paste the below text between the Private Sub and End Sub
Dim control As XRCheckBox = DirectCast(sender, XRCheckBox)
control.Checked = False
Dim curStu As Student = DirectCast(GetCurrentRow(), Student)
If curStu IsNot Nothing Then
Dim mark as TopicTermMark = curStu.Achievement.GetTopicTermMark("ENG",False,"ET001",False)
If mark IsNot Nothing Then
If Not String.IsNullOrEmpty(mark.Mark) Then
If mark.Mark.Contains("D") Then
control.Checked = True
End If
End If
End If
End If
Edit the script – change the orange text as necessary:
ENG –topic code
ET001– term code
D – the mark the student should have, to print a check in the box
- Inside the classes branch of the field tree, create a calculated field
- Give the calculated field a name that makes sense
- In the Scripts pane, first define a line outside of any other scripts: Dim classCount as Integer = 0